Introduction
In the competitive landscape of global real estate investment, rental yield stands as one of the most critical metrics for assessing property performance and comparing opportunities across markets. Abu Dhabi's rental yield profile has evolved dramatically over the past five years, transforming from a sluggish post-correction market averaging 3-4% yields in 2020 to today's robust 5.5-6.5% average for apartments, with certain areas delivering gross yields exceeding 8%.
For sophisticated investors evaluating Abu Dhabi as part of a global portfolio strategy, understanding the nuances between gross and net yields, area-specific performance, and cost structures is essential for accurate return projections and competitive market positioning. This comprehensive guide examines Abu Dhabi's rental yield landscape, providing the analytical framework and local market intelligence necessary for informed investment decisions.
Whether you're a family office manager seeking stable income streams, a fund manager allocating capital to emerging markets, or an individual investor building a property portfolio, this analysis delivers the quantitative insights required for data-driven decision-making in Abu Dhabi's evolving real estate market.
Understanding Rental Yields: Definitions and Calculations
What is Rental Yield?
Rental yield represents the annual income return on a property investment, expressed as a percentage of the property's value. It serves as the real estate equivalent of bond yields or dividend yields in equity markets, providing a standardized metric for comparing investment performance across assets, locations, and property types.
The yield calculation offers investors immediate insight into:
- Income generation potential: How much cash flow the property produces
- Market competitiveness: How returns compare to alternative investments
- Pricing efficiency: Whether properties are over or undervalued relative to rental income
- Investment strategy alignment: Whether the property suits income or growth objectives
Gross Rental Yield: The Basic Calculation
Gross rental yield provides the simplest income assessment, calculating returns before accounting for ownership expenses:
Gross Rental Yield (%) = (Annual Rental Income / Property Purchase Price) × 100
Property Purchase Price: AED 1,200,000Monthly Rent: AED 70,000
Annual Rent: AED 840,000
Gross Yield = (840,000 / 1,200,000) × 100 = 7.0%
Advantages of Gross Yield
- Quick comparison tool for initial screening
- Easy calculation with minimal data requirements
- Useful for standardized market comparisons
- Industry-standard metric for property listings
Limitations of Gross Yield
- Ignores operating expenses, which vary significantly by property
- Doesn't account for vacancy periods
- Excludes maintenance, management fees, and service charges
- Can overstate actual investment returns by 30-50%
Net Rental Yield: The Realistic Return
Net rental yield accounts for the ongoing costs of property ownership, providing a more accurate picture of actual investment returns:
Net Rental Yield (%) = [(Annual Rental Income - Annual Expenses) / Property Purchase Price] × 100
Property Purchase Price: AED 1,200,000Annual Rental Income: AED 840,000
Annual Expenses:
- Service Charges (AED 20/sqft × 1,000 sqft): AED 20,000
- Property Management (5% of rent): AED 42,000
- Maintenance Reserve (2% of value): AED 24,000
- Insurance: AED 3,000
- Vacancy Provision (1 month/year): AED 70,000
- Miscellaneous (agent fees, minor repairs): AED 8,000
Total Annual Expenses: AED 167,000
Net Annual Income: AED 840,000 - AED 167,000 = AED 673,000
Net Yield = (673,000 / 1,200,000) × 100 = 5.61%
In this example, expenses consume 19.9% of gross rental income, reducing the yield from 7.0% (gross) to 5.61% (net)—a 1.39 percentage point reduction. This expense ratio varies significantly based on:
- Property age and condition
- Building quality and service charge structure
- Property management arrangements
- Location-specific costs
For Abu Dhabi properties, expense ratios typically range from 15-25% of gross rental income, meaning net yields average 1.5-2.5 percentage points lower than gross yields advertised in property listings.
Abu Dhabi's Rental Yield Landscape: 2026 Market Overview
Current Market Yields by Property Type
Abu Dhabi's rental yield profile reflects its position as a maturing real estate market balancing capital appreciation with income generation:
Apartments (Citywide Average)
- Gross Yield Range: 6.0-8.0%
- Average Gross Yield: 6.78% (REIDIN Dec 2025)
- Average Net Yield: 4.5-5.5%
- Best Performance: Studios and 1-bedroom units
Villas (Citywide Average)
- Gross Yield Range: 4.5-6.5%
- Average Gross Yield: 4.83% (REIDIN Dec 2025)
- Average Net Yield: 3.0-4.5%
- Best Performance: Affordable villa communities (Al Reef, Khalifa City)
Luxury Properties
- Gross Yield Range: 2.5-5.0%
- Average Gross Yield: 3.5-4.0%
- Average Net Yield: 2.0-3.0%
- Market Characteristic: Capital appreciation focus over income
The villa-apartment yield differential of approximately 2 percentage points reflects several market dynamics:
- Higher villa purchase prices relative to rental premiums
- Lower rental demand density for villas
- Higher maintenance costs for standalone properties
- Luxury villa buyers prioritizing lifestyle over yields
Geographic Yield Distribution
Abu Dhabi's rental yields vary significantly by location, creating distinct investment profiles across the emirate:
| Area | Property Type | Gross Yield | Net Yield | Key Characteristic |
|---|---|---|---|---|
| Al Reef | Apartments | 8-9% | 6-7% | Highest yields, affordable segment |
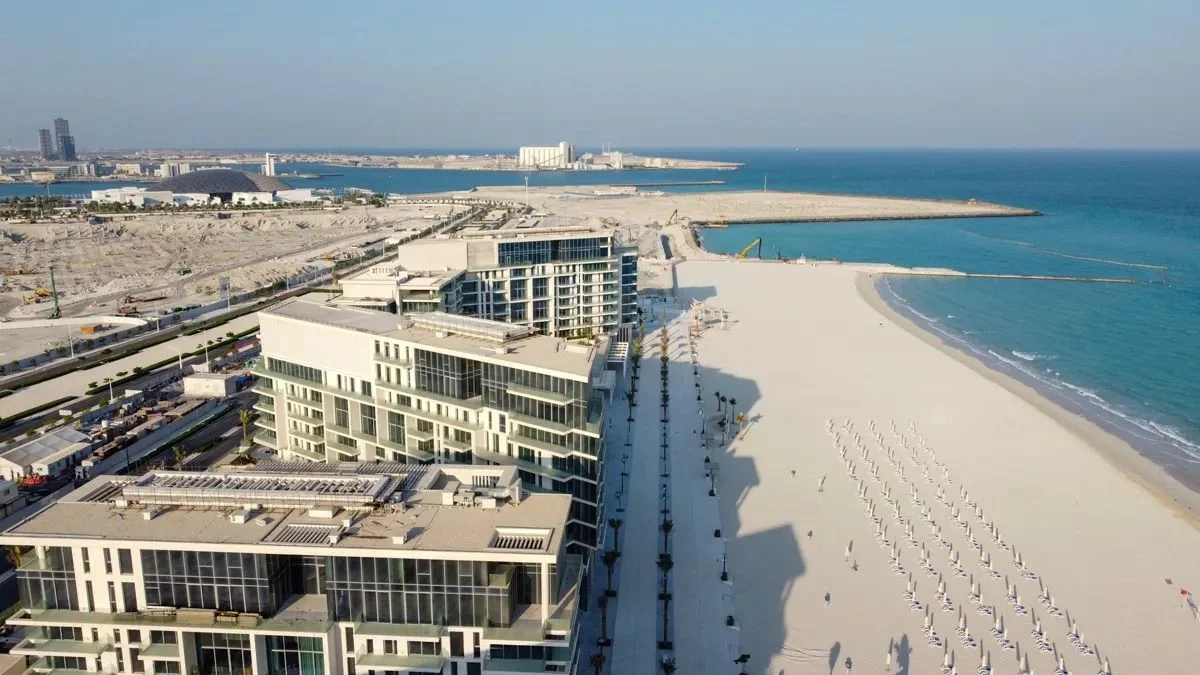
| Masdar City | Apartments | 7-8% | 5-6% | Sustainable living premium |
| Al Reem Island | Apartments | 7-8% | 5.5-6.5% | High liquidity, professional tenants |
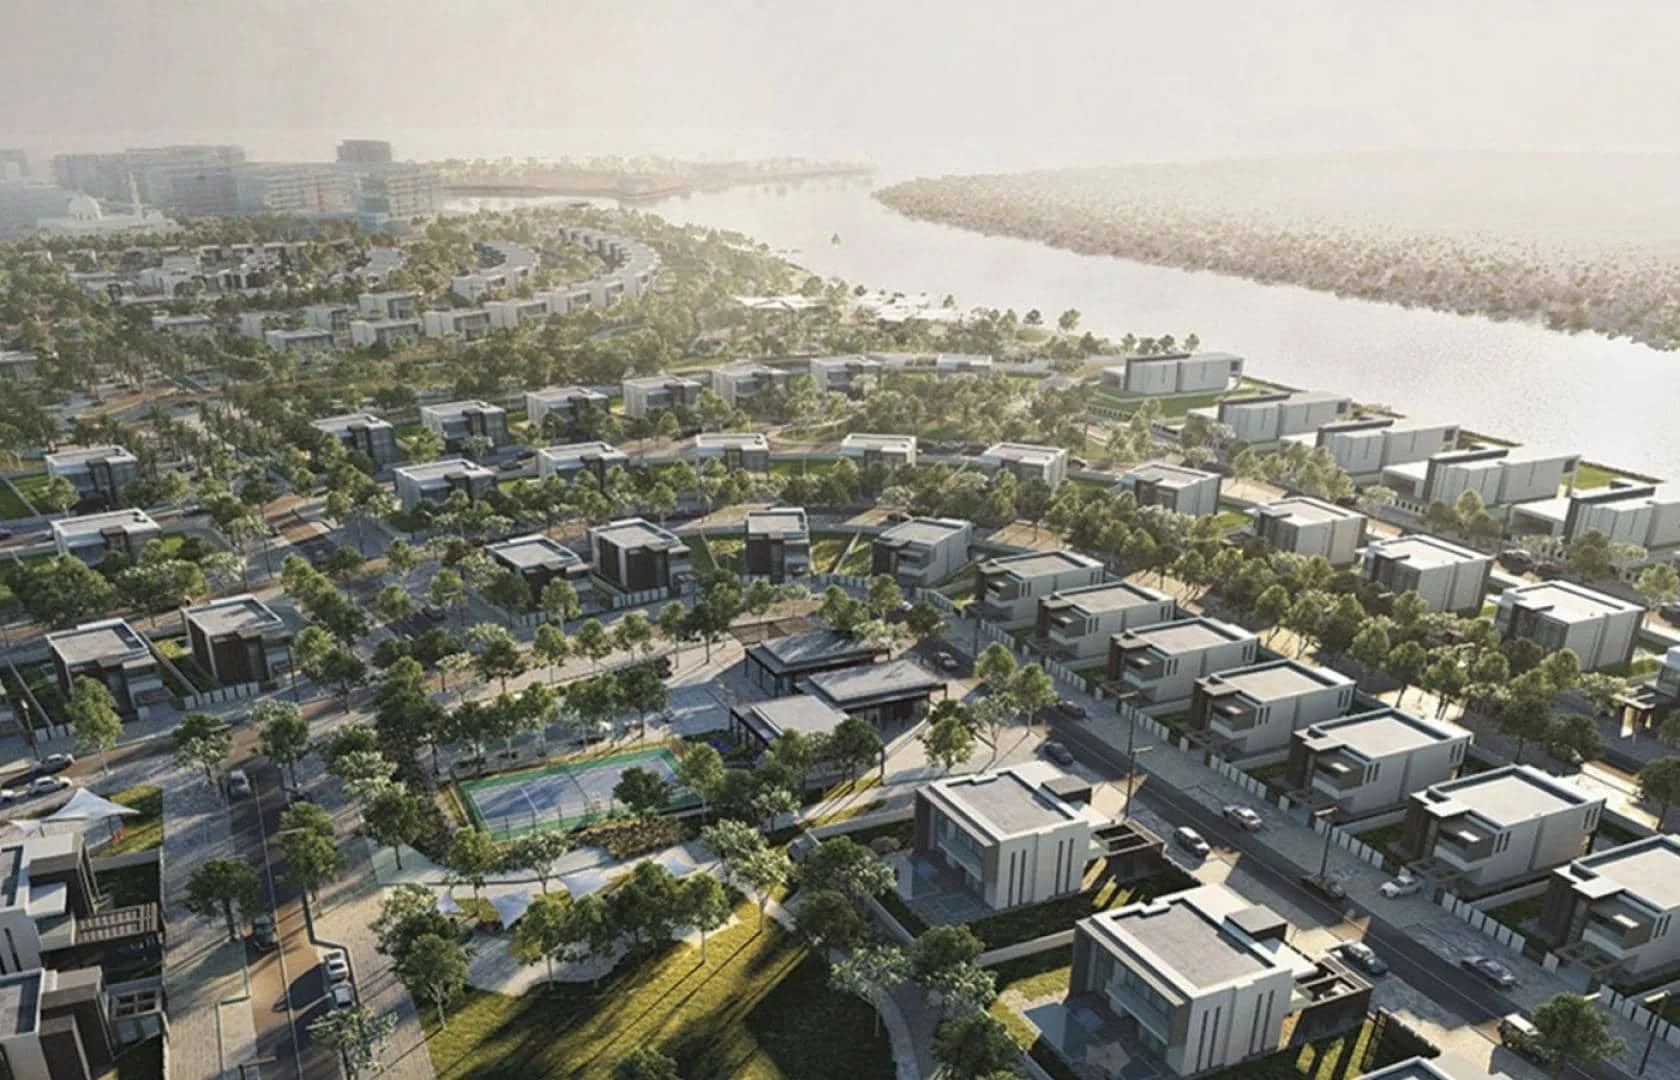
| Al Ghadeer | Villas/Apts | 8-8.5% | 6-6.5% | Emerging community, family focus |
| Khalifa City | Villas | 6-7% | 4.5-5.5% | Established residential area |
| Yas Island | Apartments | 5-7% | 3.5-5% | Lifestyle premium, entertainment hub |
| Reem Hills | Villas | 5-6% | 3.5-4.5% | New development, appreciation play |
| Saadiyat Island | Luxury | 4-6% | 2.5-4% | Capital preservation, culture focus |
| Al Maryah Island | Luxury | 4-5% | 2.5-3.5% | Financial district, high prices |
Investment Implications
- Yield compression of 40-50% from high-yield to luxury areas
- Geographic diversification can balance income and appreciation
- Tenant demographic varies significantly by area, affecting vacancy risk
- Liquidity tends to decrease as yields increase (inverse relationship)
Detailed Cost Breakdown: From Gross to Net Yield
Understanding the expense structure is critical for accurate net yield calculations and realistic investment projections.
Service Charges (Largest Ongoing Cost)
Service charges represent the most significant recurring expense for Abu Dhabi property owners, typically consuming 10-18% of annual rental income.
2026 Service Charge Structure
| Property Category | Cost per Sqft/Year | Annual Cost (1,000 sqft) | % of AED 70k Rent |
|---|---|---|---|
| Standard Buildings | AED 10-15 | AED 10,000-15,000 | 14-21% |
| Modern Developments | AED 15-20 | AED 15,000-20,000 | 21-29% |
| Luxury Properties | AED 20-25 | AED 20,000-25,000 | 29-36% |
| Ultra-Luxury | AED 30+ | AED 30,000+ | 43%+ |
What Service Charges Cover
- Common area maintenance (lobbies, corridors, elevators)
- Swimming pool, gym, and amenity upkeep
- Security and concierge services
- Building exterior maintenance and cleaning
- Waste management and pest control
- Landscaping and irrigation
- Shared utility costs (common area lighting, AC)
Before purchasing, request the property's service charge history for the past 3 years to identify trends. Buildings with increasing charges may indicate deferred maintenance or management issues.
Property Management Fees
While optional for owner-occupiers, professional property management is recommended for investors, particularly those based outside Abu Dhabi.
Management Fee Structure
- Standard Rate: 5-8% of monthly rental income
- For AED 70,000 annual rent: AED 3,500-5,600 per year
- Services Included: Tenant sourcing, rent collection, maintenance coordination, lease renewals, legal compliance
Self-managing properties can eliminate this 5-8% cost but requires:
- Local presence or dedicated time availability
- Knowledge of UAE tenancy laws and ADDC regulations
- Ability to handle tenant emergencies and maintenance issues
- Risk of longer vacancy periods without professional marketing
For international investors or those owning multiple properties, professional management typically delivers superior net returns despite the fee by minimizing vacancy, optimizing rent levels, and preventing costly legal issues.
Maintenance and Reserve Costs
Properties require ongoing maintenance beyond service charges:
Annual Maintenance Budget
- Appliance replacement reserve: 1-2% of property value
- AC maintenance/replacement: AED 2,000-5,000 per unit
- Paint and minor repairs: AED 1,000-3,000 annually
- Emergency maintenance fund: AED 2,000-4,000
For a AED 1,200,000 property, budget AED 24,000-36,000 annually for maintenance. Older properties (15+ years) may require 3-4% annually.
Insurance Costs
Property insurance is recommended though not mandatory for most investors:
Insurance Costs (2026)
- Building and contents: AED 2,000-4,000 per apartment
- Rental income protection: Additional AED 1,000-2,000
- Public liability: Often included in service charges
Total annual insurance: AED 3,000-6,000 depending on coverage level and property value.
Vacancy Provision
Even well-located properties experience vacancy between tenants:
Abu Dhabi Vacancy Patterns
- High-demand areas (Al Reem, Yas): 1-2 months per 2 years
- Standard areas: 1-2 months annually
- Lower-demand areas: 2-3 months annually
A 1-month vacancy on AED 70,000 annual rent = AED 70,000/12 = AED 5,833 lost income plus agent fees for re-letting (typically 5% or AED 3,500).
Conservative Yield Calculation: Always provision for 1-2 months vacancy annually when calculating net yield, reducing gross income by 8-16%.Summary: Total Expense Impact
Comprehensive Annual Expense Example (AED 1,200,000 apartment)
| Expense Category | Annual Cost | % of AED 840k Rent |
|---|---|---|
| Service Charges | AED 20,000 | 2.4% |
| Management Fees (5%) | AED 42,000 | 5.0% |
| Maintenance Reserve | AED 24,000 | 2.9% |
| Insurance | AED 3,000 | 0.4% |
| Vacancy (1 month) | AED 70,000 | 8.3% |
| Miscellaneous | AED 8,000 | 1.0% |
| TOTAL | AED 167,000 | 19.9% |
Result
- Gross Yield: 7.0%
- Net Yield: 5.61%
- Expense Impact: -1.39 percentage points
This expense ratio is typical for mid-tier Abu Dhabi properties. Luxury properties often see 25-30% expense ratios, while value properties in newer buildings may achieve 15-18% ratios.
Abu Dhabi Yields in Global Context
Understanding Abu Dhabi's competitive positioning requires comparison to major global investment markets.
Global Rental Yield Comparison (2026)
| City | Gross Yield Range | Net Yield Range | Market Character |
|---|---|---|---|
| Abu Dhabi | 5.5-8.0% | 4.0-6.5% | Emerging, stable growth |
| Dubai | 7.0-10.0% | 5.5-8.0% | High yield, higher volatility |
| London | 3.0-5.5% | 1.5-3.5% | Mature, capital preservation |
| New York | 3.5-6.0% | 2.0-4.0% | Mature, diverse segments |
| Singapore | 2.5-4.0% | 1.0-2.5% | Low yield, stable appreciation |
| Hong Kong | 2.0-3.5% | 0.5-2.0% | Capital growth focused |
| Berlin | 4.0-5.5% | 2.5-4.0% | Regulated, moderate returns |
| Toronto | 3.5-5.0% | 2.0-3.5% | Stable, family oriented |
Key Observations
- Abu Dhabi's Yield Premium: Abu Dhabi offers 200-400 basis points higher net yields than most major Western cities, providing significant income advantages for investors.
- Risk-Return Profile: Higher yields typically correlate with emerging market risk, currency volatility, and regulatory uncertainty—factors mitigated in Abu Dhabi through:
- UAE dirham peg to US dollar (stable currency)
- Mature regulatory framework (ADDC, RERA)
- Government stability and economic diversification
- Zero property and income tax environment
- Yield-Growth Balance: Unlike ultra-low-yield markets (Hong Kong, Singapore) where returns depend entirely on capital appreciation, Abu Dhabi offers balanced returns from both income and growth.
- Competitive Position: Abu Dhabi sits in the "sweet spot" of 4-6.5% net yields—high enough to generate meaningful income, low enough to attract capital appreciation as the market matures.
Investment Strategy Implications
For Income-Focused Investors:Abu Dhabi's 4-6.5% net yields provide attractive income relative to:
- US Treasury bonds (4-5% as of 2026)
- S&P 500 dividend yield (1.5-2%)
- UK government gilts (3.5-4.5%)
- European investment-grade bonds (2-3.5%)
With real asset backing, inflation hedging, and potential capital appreciation, Abu Dhabi properties offer compelling risk-adjusted income returns.
For Capital Preservation:While not matching London or Singapore's stability pedigree, Abu Dhabi's government backing, controlled supply, and economic diversification provide emerging market exposure with developed market characteristics.
Investment Strategies by Yield Target
Different investors have different return objectives. Here's how to align property selection with yield goals:
High-Yield Strategy (Target: 6-8% Net Yield)
Profile: Income-focused investors prioritizing cash flow over capital appreciation.Target Areas
- Al Reef (8-9% gross)
- Al Ghadeer (8-8.5% gross)
- Masdar City (7-8% gross)
- Al Reem Island (7-8% gross)
Property Specifications
- Studios and 1-bedroom apartments
- Size: 400-700 sqft
- Price range: AED 600,000-1,000,000
- Building age: 5-15 years
- Tenant demographic: Young professionals, singles
Risk Considerations
- Lower capital appreciation potential (3-5% annually)
- Higher tenant turnover (shorter lease terms)
- Locations may have limited resale liquidity
- Demographic concentration risk (employment-dependent tenants)
Sample Portfolio (AED 3,000,000)
- 3× Al Reem Island 1-beds @ AED 1,000,000 each
- Expected gross yield: 7.5%
- Expected net yield: 6.0%
- Annual net income: AED 180,000
- Capital appreciation: 4-5%
- Total return: 10-11%
Balanced Strategy (Target: 4.5-6% Net Yield)
Profile: Investors seeking income with capital appreciation potential.Target Areas
- Yas Island (5-7% gross)
- Reem Hills (5-6% gross)
- Khalifa City (6-7% gross)
- Al Reem Island (7-8% gross)
Property Specifications
- 2-bedroom apartments or small villas
- Size: 900-1,400 sqft
- Price range: AED 1,200,000-2,500,000
- Building age: 0-10 years
- Tenant demographic: Families, mid-career professionals
Risk Considerations
- Moderate capital appreciation (5-7% annually)
- Balanced tenant stability
- Good resale liquidity
- Area appreciation dependent on infrastructure development
Sample Portfolio (AED 5,000,000)
- 1× Yas Island 2-bed @ AED 2,000,000
- 2× Reem Hills 2-beds @ AED 1,500,000 each
- Expected gross yield: 6.0%
- Expected net yield: 4.5%
- Annual net income: AED 225,000
- Capital appreciation: 6-7%
- Total return: 10.5-11.5%
Growth-Focused Strategy (Target: 2.5-4% Net Yield)
Profile: Investors prioritizing long-term capital appreciation over immediate income.Target Areas
- Saadiyat Island (4-6% gross)
- Al Maryah Island (4-5% gross)
- Premium Yas Island (5-6% gross)
- Mamsha Al Saadiyat (4-5% gross)
Property Specifications
- 3-bedroom+ luxury apartments or villas
- Size: 1,800-4,000+ sqft
- Price range: AED 3,000,000-15,000,000+
- Building age: 0-5 years
- Tenant demographic: Executives, wealthy families, diplomats
Risk Considerations
- Lower immediate income (2.5-4% net yield)
- Higher capital appreciation potential (7-10% annually)
- Excellent resale liquidity in luxury segment
- Economic downturn risk (luxury market more volatile)
Sample Portfolio (AED 10,000,000)
- 1× Saadiyat Island villa @ AED 6,000,000
- 1× Al Maryah Island 3-bed @ AED 4,000,000
- Expected gross yield: 4.5%
- Expected net yield: 3.0%
- Annual net income: AED 300,000
- Capital appreciation: 8-9%
- Total return: 11-12%
Rental Yield Trends: 2020-2026 Analysis
Understanding yield evolution provides context for current market positioning and future projections.
Historical Yield Performance
2020-2022: Recovery Phase- Average gross yields: 4-5%
- Average net yields: 2.5-3.5%
- Market characteristic: Post-correction stabilization, limited transaction activity
- Key driver: Pandemic impact reducing demand while prices remained sticky
- Average gross yields: 5-6.5%
- Average net yields: 3.5-5.0%
- Market characteristic: Strong rental growth outpacing price increases
- Key drivers: Population growth (+7.5% in 2024), economic diversification, visa reforms
- Average gross yields: 6.0-6.78%
- Average net yields: 4.5-5.5%
- Market characteristic: Balanced growth with yield stability
- Key drivers: Supply discipline, lifestyle premium expansion, FDI surge
Yield Trend Drivers
Factors Increasing Yields (2020-2024)
- Rental recovery: Rents increased 25-35% from 2020 lows
- Price stability: Property prices grew moderately (15-20%)
- Demand surge: Population increased 15% from 2020 to 2024
- Supply control: Limited new completions maintained occupancy
Factors Stabilizing Yields (2025-2026)
- Price catch-up: Property prices accelerating (6-8% annually)
- Rental moderation: Rent growth slowing to 4-6% annually
- Supply increase: New developments entering market
- Market maturation: Yield compression toward regional norms
2027-2028 Yield Outlook
- Projected stabilization: 5.5-6.5% gross, 4.0-5.0% net
- Compression drivers: Price appreciation outpacing rent growth
- Divergence: High-yield areas may maintain premiums while luxury compresses
- Investment implication: Current yields (2026) may represent near-peak levels, favoring early entry
Factors Affecting Individual Property Yields
Beyond area-level averages, specific property characteristics significantly impact yield performance:
Location Micro-Factors
Proximity to Infrastructure
- Metro stations: +0.5-1.0% yield premium
- Major highways: +0.3-0.5% yield premium
- Business districts: +0.5-1.5% yield premium
- Schools (family areas): +0.5-1.0% yield premium
View and Orientation
- Marina/water views: +0.3-0.8% rental premium
- Park/green views: +0.2-0.4% rental premium
- City skyline views: +0.3-0.5% rental premium
- Ground floor (negative): -0.5-1.0% rental discount
Property-Specific Factors
Building Quality and Age
- New buildings (0-5 years): Base reference
- Mid-age buildings (5-15 years): -0.5-1.0% yield impact
- Older buildings (15+ years): -1.0-2.0% yield impact
- Recently renovated: +0.5% yield recovery
Amenities Impact
- Swimming pool: +5-8% rental premium
- Gym facilities: +3-5% rental premium
- Children's play area: +3-5% rental premium (family areas)
- Parking (2 spaces vs 1): +5-10% rental premium
- Balcony: +5-8% rental premium
Unit Configuration
- Open-plan layouts: +3-5% rental premium
- Built-in wardrobes: +2-3% rental premium
- Modern kitchen: +5-8% rental premium
- Master bedroom en-suite: +5% rental premium
- Maid's room: +8-12% rental premium (larger units)
Management and Maintenance
Building Management Quality
- Excellent reputation: +0.5-1.0% yield premium
- Poor management: -1.0-2.0% yield impact
- 24/7 security: +0.3-0.5% rental premium
- Concierge services: +0.5-1.0% rental premium
Service Charge Efficiency
- Low service charges (below AED 15/sqft): +0.5-1.0% net yield boost
- High service charges (above AED 25/sqft): -1.0-2.0% net yield impact
Practical Yield Optimization Strategies
For investors seeking to maximize rental returns, consider these actionable strategies:
Strategy 1: Furnishing Premium
Unfurnished vs. Furnished Yield Impact
- Unfurnished: Base rental rate
- Furnished: +15-25% rental premium
- Fully furnished + equipped: +25-35% rental premium
Unfurnished 1-bed rent: AED 65,000/yearFurnished rent: AED 75,000/year (+15%)
Furnishing investment: AED 40,000
Additional annual income: AED 10,000
ROI on furnishing: 25% annually
Payback period: 4 years
Best Applications
- Al Reem Island (high expat professional tenant base)
- Yas Island (short-term resident appeal)
- Al Maryah Island (executive housing)
Avoid
- Family villa communities (families prefer unfurnished)
- Long-term local resident areas
Strategy 2: Multi-Unit Bulk Ownership
Volume Advantages
- Negotiated purchase price: 3-5% discount for multiple units
- Service charge negotiation: Potential 10-15% reduction
- Management fee optimization: Reduced rates for portfolio management
- Maintenance efficiency: Bulk contractor rates
- Vacancy averaging: Portfolio-level occupancy smoothing
Single Unit:
- Management fee: 8% of rent
- Service charges: Full rate
- Maintenance: Retail pricing
- Vacancy risk: Binary (occupied or empty)
5-Unit Portfolio:
- Management fee: 5% of total rent (negotiated)
- Service charges: 10% reduction (volume negotiation)
- Maintenance: 20% contractor discount
- Vacancy risk: Averaged across 5 units
Strategy 3: Off-Plan Purchase for Yield
Off-Plan Advantages
- Purchase discount: 15-20% below ready property prices
- Payment plan: Spread investment over 2-3 years
- Modern design: Higher rental appeal
- Lower service charges: New buildings typically more efficient
- Warranty coverage: Reduced maintenance costs first 5 years
Ready Property Price: AED 1,200,000Rental Income: AED 72,000
Gross Yield: 6.0%
Off-Plan Purchase: AED 1,000,000 (17% discount)
Same Rental Income: AED 72,000
Gross Yield: 7.2%
Yield Improvement: +1.2 percentage points
Risk Considerations
- Construction delays impacting income start
- Developer delivery risk
- Market rent changes during construction period
- Initial area immaturity affecting rental demand
Strategy 4: Value-Add Renovations
High-ROI Renovation Projects
| Renovation | Cost | Rental Increase | Annual ROI |
|---|---|---|---|
| Kitchen modernization | AED 25,000 | +8% | 23% |
| Bathroom upgrade | AED 15,000 | +5% | 24% |
| Built-in wardrobes | AED 12,000 | +3% | 18% |
| Fresh paint + flooring | AED 8,000 | +4% | 36% |
| Smart home integration | AED 6,000 | +3% | 36% |
Mid-age properties (10-15 years) in prime locations where renovation can restore rental competitiveness at costs significantly below price-per-sqft differentials.
Common Yield Calculation Mistakes
Avoid these frequent errors that lead to unrealistic return expectations:
Mistake 1: Using Asking Rent Instead of Achieved Rent
Many investors calculate yields based on property listing rent rather than actual market rent:
Problem
- Listing rent: AED 85,000 (aspirational)
- Achieved rent: AED 75,000 (actual)
- Yield overstatement: 13.3%
- Property management companies
- ADDC rent index data
- Recent tenancy contract comparables
- Local real estate agents
Mistake 2: Ignoring Vacancy and Re-Letting Costs
Problem:Calculating yield as: (Annual Rent / Price) × 100
Reality
- 1-month vacancy per year: -8.3% income
- Agent re-letting fee: -5% of annual rent
- Effective annual income: 86.7% of advertised rent
Mistake 3: Underestimating Service Charges
Problem:Using generic service charge estimates (e.g., AED 10/sqft for all properties)
Reality:Service charges range AED 10-30+/sqft depending on building type, dramatically impacting net yield.
Solution: Request actual service charge invoices from seller before purchase to calculate precise net yield.Mistake 4: Overlooking Hidden Costs
Commonly Missed Expenses
- AC maintenance/replacement: AED 2,000-5,000 annually
- Waste management fees: AED 300-600 annually
- Building cooling charges: AED 0.15-0.35/sqft monthly
- Ejari registration: AED 170 per tenancy
- Property sale costs (when selling): 2-4% transaction costs
Conclusion
Rental yields in Abu Dhabi have evolved from post-correction lows of 3-4% in 2020 to today's robust 6-8% gross yields (4.5-6.5% net) for well-selected properties, positioning the emirate among the most attractive income-producing markets globally. This transformation reflects fundamental market improvements: population growth of 7.5% in 2024, controlled supply discipline with only 46,600 units entering through 2028, and a regulatory maturation that provides investor confidence while maintaining yield premiums over developed Western markets.
Key Takeaways for Investors
- Understand the Gross-Net Gap: Abu Dhabi properties typically see 1.5-2.5 percentage point reductions from gross to net yield due to service charges (10-18% of rent), management fees (5-8%), maintenance (2-3% of value), and vacancy provisions (8-16% of gross income).
- Geographic Selection Matters: Yield differentials of 3-4 percentage points exist between high-yield areas (Al Reef, Al Ghadeer: 8-9% gross) and luxury locations (Saadiyat, Al Maryah: 4-5% gross), creating distinct investment profiles for income vs. appreciation strategies.
- Global Competitiveness: Abu Dhabi's 4-6.5% net yields provide 200-400 basis points premium over London (1.5-3.5%), New York (2-4%), and Singapore (1-2.5%), with emerging market returns but developed market stability characteristics including currency peg, zero taxation, and government backing.
- Yield Trajectory: Current 2026 yields may represent near-peak levels as price appreciation (6-8% annually) begins outpacing rent growth (4-6% annually), suggesting early entry advantages for income-focused investors.
- Optimization Opportunities: Strategic approaches including furnishing (15-25% rent premium), bulk ownership (0.5-1.0% yield improvement through efficiencies), off-plan purchasing (1-1.5% yield boost via discounts), and value-add renovations (20-30% ROI) can materially enhance returns.
For sophisticated investors, Abu Dhabi represents a compelling allocation opportunity: a market large enough for institutional deployment, stable enough for fiduciary portfolios, and yield-rich enough for meaningful income generation—all while offering balanced capital appreciation potential as the emirate's economic diversification and population growth continue through the decade.
Whether pursuing aggressive 6-8% net yield strategies in mid-tier properties or conservative 3-4% yields in luxury segments with appreciation upside, Abu Dhabi's rental market provides the analytical transparency, regulatory framework, and return profile to support data-driven investment decision-making at scale.