Introduction
Abu Dhabi is entering the most significant residential construction cycle in its history. Between 2026 and 2028, an estimated 33,000+ new residential units will be delivered across the emirate — a wave of supply that will reshape neighborhood dynamics, redefine price benchmarks in emerging areas, and create both opportunities and risks for investors who understand the numbers.
The delivery schedule is not evenly distributed. Approximately 6,500 units are expected in 2026, rising sharply to 12,400 in 2027, and peaking at over 21,000 units from 2028 onward as mega-projects like Al Riyadh City and Hudayriyat Island developments reach completion. This front-loaded pipeline means that 2027 will be the critical year — the moment when the market's ability to absorb new supply will be tested.
Yet these supply figures must be read alongside equally powerful demand indicators: Abu Dhabi's population is growing at 7.5% annually, Golden Visa reforms are attracting permanent residents, and the emirate recorded AED 142 billion in real estate transactions across 42,814 deals in 2025. The question is not whether supply is coming — it clearly is — but whether demand growth will outpace it, stabilize against it, or fall short. This report provides the data investors need to form their own conclusions.
The Supply Pipeline: Year-by-Year Breakdown
Scheduled Residential Deliveries 2026-2028+
| Year | Estimated Units | Key Developments | Primary Areas |
|---|---|---|---|
| 2026 | ~6,500 | Bloom Living Phase 1-2, Athlon Phase 1, Waters Edge, Reeman Living 3 | Yas Island, Al Shamkha, Al Reem Island |
| 2027 | ~12,400 | Saadiyat Reserve phases, Yas Acres expansions, Bloom Cordoba/Casares, Masdar City phases | Saadiyat, Yas, Masdar, Khalifa City |
| 2028+ | ~21,000+ | Al Riyadh City major phases, Hudayriyat Island, IMKAN mega-projects, Ramhan Island | Al Shamkha, Hudayriyat, Al Raha |
| Total | ~33,400+ |
> Context: Abu Dhabi's existing residential stock is estimated at approximately 280,000-300,000 units. The 33,000+ unit pipeline represents an 11-12% increase in total housing stock over three years — a substantial but not unprecedented expansion rate for a rapidly growing Gulf capital.
Quarterly Delivery Forecast — 2026
| Quarter | Est. Units | Major Handovers | Area Focus |
|---|---|---|---|
| Q1 2026 | ~1,200 | Bloom Living Phase 1 (select buildings), Reeman Living 2 completions | Al Shamkha, Al Reem |
| Q2 2026 | ~1,800 | Athlon Phase 1 (apartments), Waters Edge (select towers) | Yas Island, Yas Bay |
| Q3 2026 | ~1,700 | Bloom Living Phase 2 (initial buildings), Saadiyat projects | Al Shamkha, Saadiyat |
| Q4 2026 | ~1,800 | Year-end completions, delayed H1 projects rolling over | Mixed |
Breakdown by Area: Where Is Supply Concentrated?
Supply Distribution by Location (2026-2028)
| Area | Total Units 2026-2028 | Share of Pipeline | Current Vacancy | Supply Risk Level |
|---|---|---|---|---|
| Yas Island | ~6,800 | 20% | Low (3-5%) | Moderate |
| Al Shamkha / Al Riyadh | ~7,500 | 22% | New area | Moderate-High |
| Al Reem Island | ~3,200 | 10% | Low (4-6%) | Low-Moderate |
| Saadiyat Island | ~4,100 | 12% | Very Low (1-3%) | Low |
| Masdar City | ~2,400 | 7% | Moderate (8-10%) | Moderate |
| Khalifa City | ~2,800 | 8% | Low (5-7%) | Low-Moderate |
| Al Raha Beach | ~1,900 | 6% | Low (3-5%) | Low |
| Hudayriyat Island | ~2,200 | 7% | New area | Higher |
| Other | ~2,500 | 8% | Various | Various |
Area-by-Area Analysis
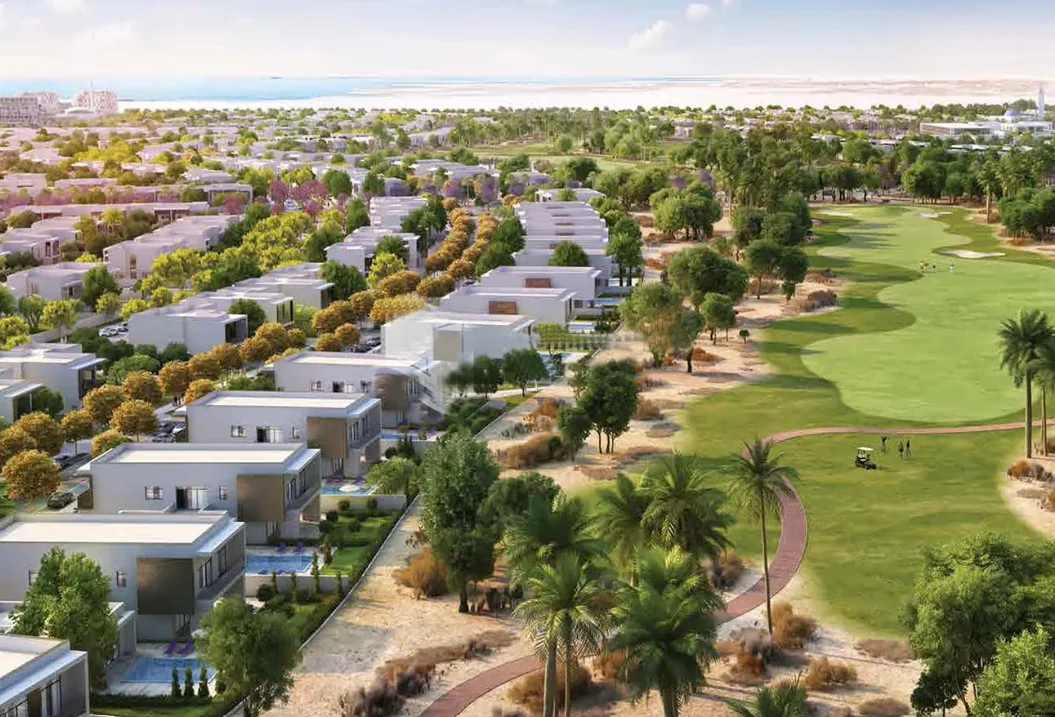
Yas Island (~6,800 units)Yas faces the most significant supply test among established areas. The island's entertainment infrastructure (Ferrari World, Warner Bros, Yas Marina Circuit) and Aldar's aggressive marketing ensure consistent demand, but 6,800 new units over three years will require strong absorption. Current rental yields of 7-8.5% may compress by 50-100 basis points as supply arrives. However, Yas has historically demonstrated strong absorption capacity — the island's reputation as Abu Dhabi's premier family entertainment destination sustains demand from both tenants and buyers.
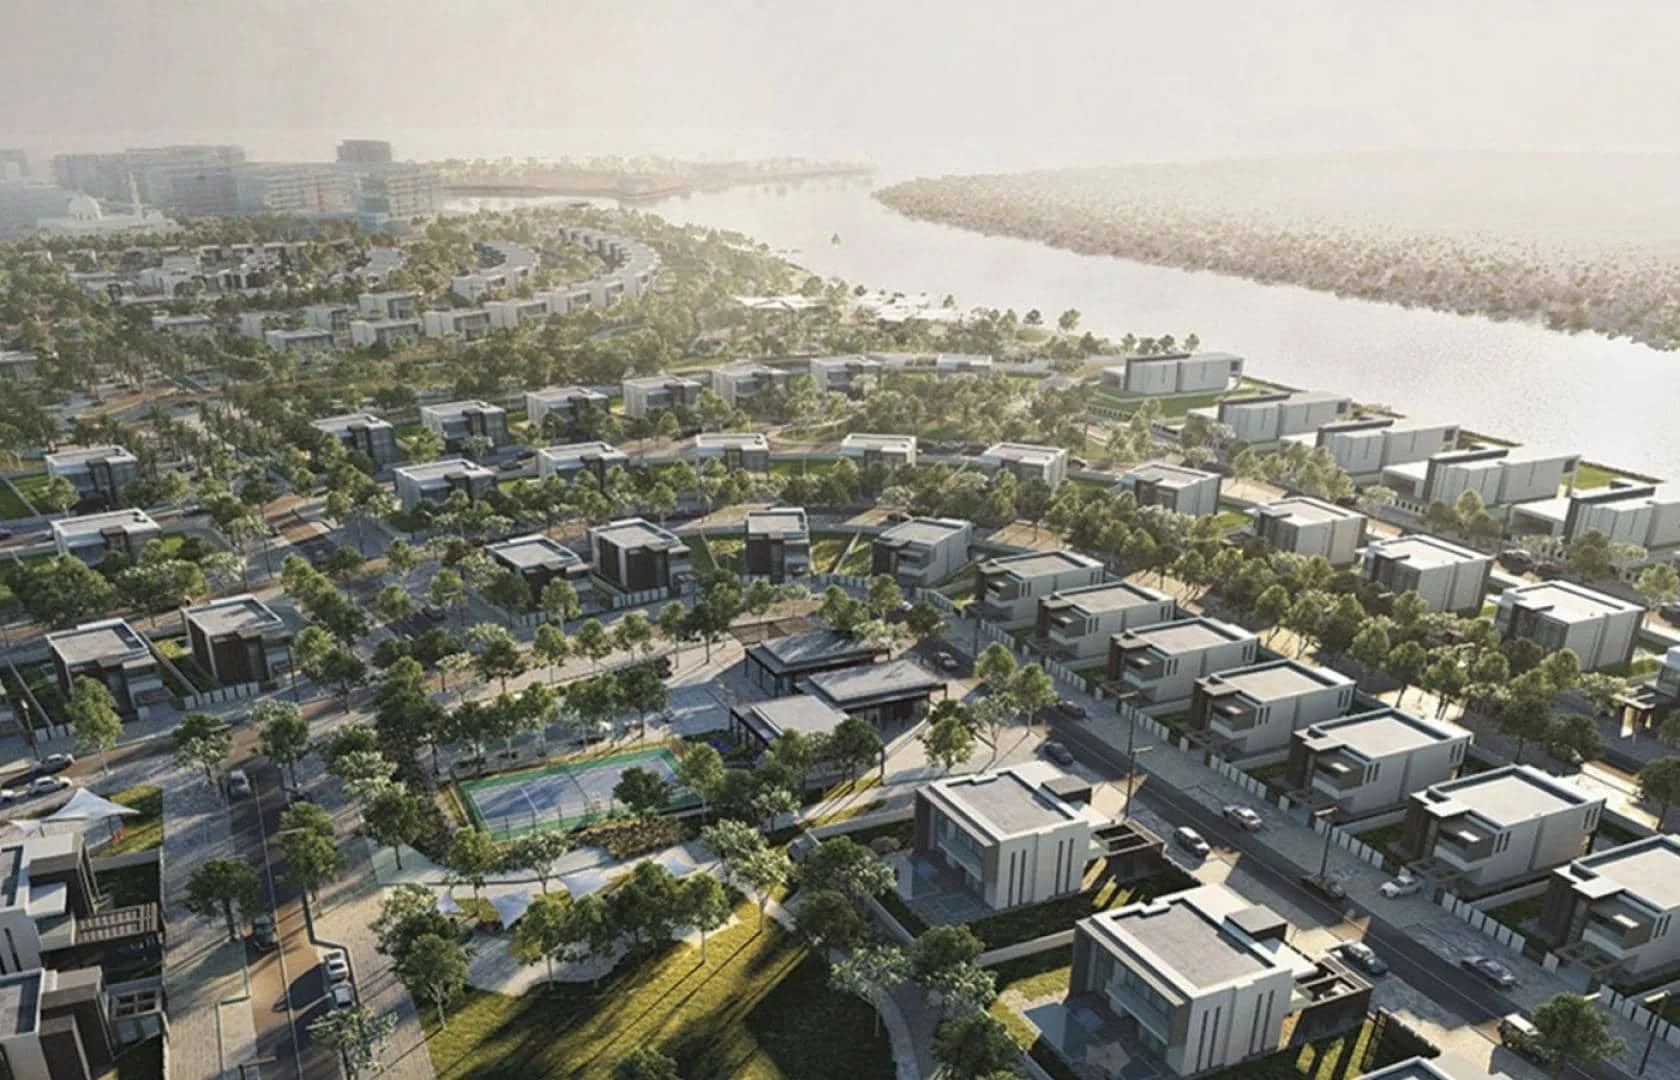
Al Shamkha / Al Riyadh City (~7,500 units)This is Abu Dhabi's most ambitious new community. Al Riyadh City, developed by Modon Properties, is designed to deliver affordable housing for Abu Dhabi's growing mid-income workforce. Prices in the AED 450K-1.2M range address a genuine market gap. The risk here is infrastructure timing — road connectivity, schools, retail, and public transport must arrive alongside or ahead of residential deliveries to ensure occupancy. If infrastructure lags, early phases may see elevated vacancy.
Saadiyat Island (~4,100 units)Saadiyat's supply pipeline is the most protected by scarcity dynamics. The island's limited land area, cultural institutions (Louvre, Guggenheim, Natural History Museum), and luxury positioning create natural demand filters. With current vacancy below 3% and prices that have appreciated 27% since 2023, Saadiyat can likely absorb new supply without meaningful price pressure. The ultra-luxury segment (branded residences, beachfront villas) faces virtually no oversupply risk.
Al Reem Island (~3,200 units)Al Reem's new supply is relatively modest given the island's established rental market and high demand from young professionals. With yields currently at 8.5-10% and vacancy below 6%, the market can absorb 3,200 additional units over three years. Key risk: Al Reem competes directly with new affordable supply in Al Shamkha — if Al Riyadh City attracts tenants who would have rented on Al Reem, yield compression could be steeper than the raw supply numbers suggest.
Impact on Prices: Scenario Analysis
Three Supply Absorption Scenarios
| Scenario | Assumption | Price Impact (2026-2028) | Probability |
|---|---|---|---|
| Bull Case | Population grows 7.5%+, demand exceeds supply | +10-18% appreciation | 35% |
| Base Case | Population grows 5-7%, supply roughly matches demand | +3-8% appreciation | 45% |
| Bear Case | Population growth slows below 4%, supply exceeds demand | -5 to +2% (flat to mild correction) | 20% |
Price Sensitivity by Segment
| Segment | Current Avg Price/sqft | Bull Case (2028) | Base Case (2028) | Bear Case (2028) |
|---|---|---|---|---|
Affordable (| AED 750 | AED 870 | AED 800 | AED 720 | |
| Mid-Market (AED 1-3M) | AED 1,250 | AED 1,475 | AED 1,340 | AED 1,210 |
| Premium (AED 3-8M) | AED 2,000 | AED 2,360 | AED 2,140 | AED 1,980 |
| Luxury (AED 8M+) | AED 3,500 | AED 4,200 | AED 3,780 | AED 3,430 |
> Key Finding: The luxury segment is the most insulated from supply-side pressure. With limited new units, high barriers to entry, and demand driven by global wealth migration, luxury prices are likely to appreciate in all three scenarios. The affordable segment faces the highest risk from Al Riyadh City's large-scale delivery, where pricing discipline will determine absorption rates.
Absorption Rate Analysis
Historical Absorption Benchmarks
| Year | New Units Delivered | Units Absorbed (Occupied within 12 months) | Absorption Rate | Vacancy Change |
|---|---|---|---|---|
| 2021 | ~3,500 | ~3,100 | 89% | -0.5% |
| 2022 | ~4,200 | ~3,900 | 93% | -0.3% |
| 2023 | ~5,800 | ~5,500 | 95% | -0.4% |
| 2024 | ~7,200 | ~6,800 | 94% | -0.2% |
| 2025 (est.) | ~8,500 | ~8,000 | 94% | -0.1% |
Abu Dhabi has maintained absorption rates above 89% over the past five years — a testament to genuine demand growth rather than speculative activity. The market has consistently absorbed new supply without vacancy increases, largely because population growth has outpaced construction completions.
Forward Absorption Requirements
| Year | Units to Absorb | Required New Households | Implied Population Growth Needed |
|---|---|---|---|
| 2026 | ~6,500 | ~5,850 (90% target) | ~4.2% |
| 2027 | ~12,400 | ~11,160 (90% target) | ~6.8% |
| 2028+ | ~21,000+ | ~18,900 (90% target) | ~8.5% |
> Critical Year: 2027. Absorbing 12,400 units at a 90% rate requires approximately 11,160 new occupied households — which implies population growth of around 6.8%. This is achievable given current 7.5% growth but leaves limited margin for economic slowdown. If population growth dips below 5% in 2027, the market will likely see vacancy increases and rental softening, particularly in affordable and mid-market segments.
Developer Delivery Schedules
Major Developer Completion Pipelines
| Developer | 2026 Deliveries | 2027 Deliveries | 2028+ Pipeline | Delivery Track Record |
|---|---|---|---|---|
| Aldar Properties | ~2,800 | ~5,200 | ~8,000+ | Excellent (95%+ on time) |
| Modon Properties | ~1,200 | ~2,800 | ~6,500+ | Good (newer developer, govt-backed) |
| Bloom Living | ~1,100 | ~2,200 | ~3,500 | Good (consistent delivery) |
| IMKAN | ~400 | ~800 | ~1,500 | Good (luxury focus, smaller volume) |
| Reportage | ~500 | ~700 | ~1,200 | Moderate (some past delays) |
| Others | ~500 | ~700 | ~800+ | Mixed |
Delivery Delay Risk Factors
Historically, 15-25% of scheduled Abu Dhabi deliveries experience delays of 3-12 months. Common causes:
- Material cost inflation: Steel and concrete prices rose 18% in 2024, squeezing developer margins
- Labour shortages: Competition with Saudi Arabia's NEOM and other mega-projects for skilled construction workers
- Design modifications: Developers upgrading specifications mid-construction to meet evolving buyer expectations
- Regulatory approvals: DMT quality inspections can delay handover certificates
This delay factor is actually beneficial for the market's supply absorption — if 20% of 2027's 12,400 units slip to 2028, the effective 2027 delivery becomes approximately 9,900 units, well within comfortable absorption capacity.
Oversupply Risk Assessment
Risk Matrix by Area and Segment
| Area | Affordable Risk | Mid-Market Risk | Premium Risk | Luxury Risk |
|---|---|---|---|---|
| Yas Island | Medium | Medium | Low | Very Low |
| Al Shamkha / Al Riyadh | Medium-High | Medium | N/A | N/A |
| Al Reem Island | Low-Medium | Low | Low | Very Low |
| Saadiyat Island | N/A | Low | Very Low | Very Low |
| Masdar City | Medium | Medium | Low | N/A |
| Khalifa City | Medium | Low-Medium | Low | N/A |
| Hudayriyat Island | N/A | N/A | Medium | Low |
Structural Protections Against Oversupply
Abu Dhabi's market has several built-in mechanisms that mitigate oversupply risk:
- Escrow account regulation: DMT requires developers to deposit buyer payments into regulated escrow accounts, preventing undercapitalized projects from launching
- Limited freehold zones: Unlike Dubai's expansive freehold map, Abu Dhabi's designated freehold areas are geographically constrained, limiting where new supply can be built
- Government land release control: Abu Dhabi's government controls the pace of land release for development, providing a macro-level supply management tool
- Population growth momentum: 7.5% annual growth creates approximately 15,000-18,000 new household formations per year — sufficient to absorb the pipeline if growth sustains
- Low existing vacancy: Starting from a base of 4-6% vacancy in most areas provides a buffer before supply additions become problematic
Price Correction Scenarios: What Could Go Wrong?
Trigger Events and Probability
| Trigger | Impact on Prices | Probability (2026-2028) | Mitigation |
|---|---|---|---|
| Oil price collapse (<$50/bbl sustained) | -10 to -15% | 10% | Abu Dhabi GDP now 50% non-oil |
| Global recession reducing expat demand | -5 to -10% | 15% | Golden Visa holders less likely to leave |
| Developer delivery glut (all on time) | -3 to -7% (localized) | 25% | Historically 20% delay buffer |
| Regional geopolitical disruption | -5 to -8% (temporary) | 10% | Abu Dhabi seen as safe haven |
| Interest rate spike (6%+ mortgage rates) | -3 to -5% | 15% | Cash buyers dominate (65%+) |
| Population growth stalls (<3%) | -5 to -12% | 10% | Government stimulus likely |
> Overall Assessment: The probability of a meaningful price correction (>10%) in 2026-2028 is estimated at 15-20%. The most likely scenario is continued price appreciation at a slower pace than 2023-2025 — a healthy normalization rather than a market downturn. Areas most vulnerable to corrections are new communities (Al Riyadh, Hudayriyat) where demand has not yet been proven at scale.
Investment Strategy: Navigating the Supply Wave
Recommendations by Investor Profile
Conservative Investors (Capital Preservation)- Focus on Saadiyat Island and Al Raha Beach — lowest supply risk, strongest demand fundamentals
- Favour ready or near-completion properties over early-stage off-plan
- Target 2-bedroom apartments and townhouses (broadest tenant/buyer pool)
- Expected return: 5-7% rental yield + 3-5% annual appreciation
- Target early phases of new Yas Island developments where launch pricing offers 15-25% discount to future ready market pricing
- Consider Al Reem Island 1-bedrooms for yield optimization
- Be prepared to hold 3-5 years through the supply cycle
- Expected return: 7-9% rental yield + 5-10% annual appreciation
- Watch for secondary market opportunities in 2027 when some investors sell pre-handover assignments at discounts
- Consider Al Riyadh City for affordable entry points with long-term upside as infrastructure develops
- Monitor developer distress signals — if any smaller developer struggles, resale units may appear at 10-15% discounts
- Expected return: Variable — potential for 20%+ returns or 5-10% short-term losses
Conclusion & Key Takeaways
- 33,000+ residential units are scheduled for delivery in Abu Dhabi between 2026-2028, representing an 11-12% increase in total housing stock
- 2027 is the critical year, with 12,400 units requiring population growth of at least 6.8% to maintain 90% absorption rates
- Saadiyat Island and Al Raha Beach face the lowest oversupply risk due to limited land, premium positioning, and sub-3% vacancy
- Al Shamkha / Al Riyadh City carries the highest supply risk, with 7,500 affordable units dependent on infrastructure delivery and employment growth
- Historical absorption rates of 89-95% provide confidence, but 2027-2028 volumes have no modern precedent in Abu Dhabi
- Price corrections of 5-10% are possible in the affordable segment but unlikely in premium and luxury tiers
- The most likely scenario is slower appreciation (3-8%) rather than a correction — a healthy market normalization that rewards patient, well-positioned investors
Sources & References
- Abu Dhabi Department of Municipalities and Transport (DMT) — Developer Registration and Project Approvals
- CBRE Abu Dhabi Residential Market Outlook — Q4 2025 Supply Pipeline Analysis
- JLL MENA Residential Market Review — 2025 Annual Report
- Knight Frank Abu Dhabi Market Update — Q3 2025 Absorption Rate Study
- Statistics Centre Abu Dhabi (SCAD) — Population Projections and Household Formation Data
- Aldar, Modon, Bloom Investor Relations — Developer Delivery Schedules and Pipeline Disclosures