The Abu Dhabi versus Dubai property investment decision is one of the most consequential choices for UAE real estate investors. This data-driven comparison examines market performance, pricing, yields, regulatory environments, and growth trajectories to inform strategic allocation decisions.
Market Size & Transaction Volume
| Metric | Abu Dhabi | Dubai | Advantage |
|---|
| Annual transaction value | AED 142 billion | AED 420+ billion | Dubai (volume) |
| YoY transaction growth | +47% | +30% | Abu Dhabi (momentum) |
| Average residential yield | 6.5-7.5% | 5-6.5% | Abu Dhabi |
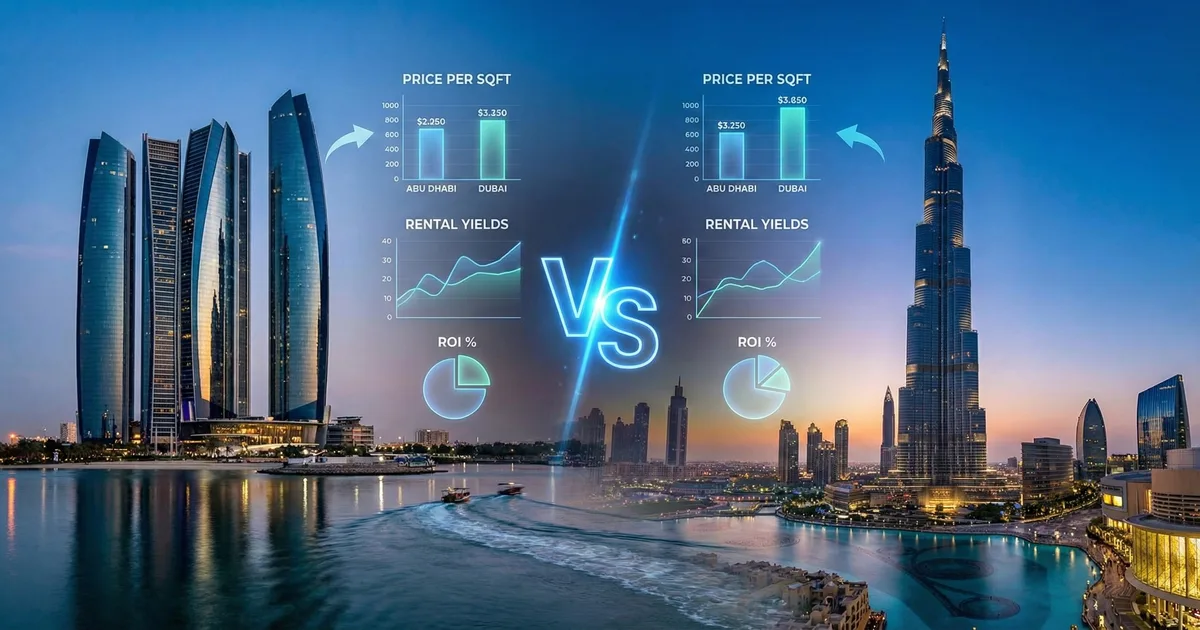
| Price per sqft (avg) | AED 1,005 | AED 1,350 | Abu Dhabi (value) |
| Off-plan as % of transactions | 66% | 58% | Dubai (secondary market depth) |
| Population growth | 7.5% annual | 5-6% annual | Abu Dhabi |
| International buyer share | 35%+ | 45%+ | Dubai (brand recognition) |
| Listed projects (portals) | 15,000+ | 80,000+ | Dubai (choice) |
| Period | Abu Dhabi Appreciation | Dubai Appreciation |
|---|
| 2020 (COVID) | -2 to +3% | -5 to +2% |
| 2021 (recovery) | +5-14% | +8-20% |
| 2022 | +8-18% | +10-25% |
| 2023 | +12-22% | +15-28% |
| 2024 | +10-32% | +10-20% |
| 2025 | +8-15% | +5-12% |
| Cumulative (6-yr) | 55-105% | 50-95% |
Key insight: Abu Dhabi showed stronger recovery stability in 2020, while Dubai appreciated faster in 2021-2023. By 2025-2026, Abu Dhabi's momentum has matched or exceeded Dubai's as the capital market matures.
Rental Yield Comparison
Yields by Property Type
| Property Type | Abu Dhabi Yield | Dubai Yield | Difference |
|---|
| Studio apartment | 7-8.5% | 6-7.5% | +1.0% AD |
| 1-bed apartment | 6.5-7.5% | 5.5-7% | +0.75% AD |
| 2-bed apartment | 5.5-7% | 5-6.5% | +0.5% AD |
| 3-bed apartment | 5-6% | 4.5-5.5% | +0.5% AD |
| Villa (premium) | 4-5.5% | 3.5-5% | +0.5% AD |
| Commercial office | 7-9% | 6-8% | +1.0% AD |
Yield by Area Comparison
Abu Dhabi yield advantage: 0.5-1.5% higher across most comparable segments, primarily due to lower purchase prices relative to rental rates.
Affordability and Entry Points
Price Comparison by Segment
| Segment | Abu Dhabi (AED) | Dubai (AED) | Abu Dhabi Discount |
|---|
| Entry apartment (studio) | 350K-550K | 450K-700K | 20-25% |
| Mid-tier 1-bed | 700K-1.1M | 900K-1.5M | 20-25% |
| Premium 2-bed | 1.2-2.0M | 1.5-3.0M | 20-30% |
| Luxury 3-bed | 2.0-3.5M | 2.5-5.0M | 20-30% |
| Premium villa | 3.5-6.0M | 5.0-10.0M | 30-40% |
| Ultra-luxury villa | 8.0-20.0M | 15.0-50.0M | 40-50% |
Key insight: Abu Dhabi offers 20-50% lower entry points across all segments, meaning higher yields on invested capital and more accessible Golden Visa qualification.
Golden Visa Property Comparison
| Factor | Abu Dhabi | Dubai |
|---|
| Minimum investment | AED 2,000,000 | AED 2,000,000 |
| Average property at threshold | 2-bed premium apartment | 1-bed premium apartment |
| Yield at threshold | 6-7% | 5-6% |
| Annual income at threshold | AED 120-140K | AED 100-120K |
| Appreciation potential | Higher (earlier growth cycle) | Moderate (more mature) |
Risk Profile Comparison
Market Stability
| Risk Factor | Abu Dhabi | Dubai | Lower Risk |
|---|
| Supply pipeline control | Tight (controlled by few developers) | Large (many developers) | Abu Dhabi |
| Government employee base | Large (stable demand) | Smaller proportion | Abu Dhabi |
| Oil economy dependency | Higher (but diversifying) | Lower | Dubai |
| Tourism dependency | Lower | Higher | Abu Dhabi |
| Speculative activity | Lower | Higher (historically) | Abu Dhabi |
| Market cycle volatility | Moderate | Higher | Abu Dhabi |
| International brand recognition | Growing | Established | Dubai |
| Oversupply risk | Low (managed supply) | Medium (large pipeline) | Abu Dhabi |
Historical Drawdown Comparison
| Market Correction | Abu Dhabi Peak-to-Trough | Dubai Peak-to-Trough |
|---|
| 2008-2011 (GFC) | -30 to -40% | -50 to -60% |
| 2015-2020 (oil/correction) | -15 to -25% | -25 to -35% |
| 2020 (COVID) | -2 to -5% | -5 to -10% |
Key insight: Abu Dhabi has historically experienced shallower drawdowns than Dubai during market corrections, reflecting lower speculative activity and more stable demand drivers.
Regulatory Environment
Property Registration and Governance
| Factor | Abu Dhabi (ADREC) | Dubai (DLD) |
|---|
| Registration fee | 2% | 4% |
| Transfer process | Streamlined digital | Streamlined digital |
| Escrow regulation | Mandatory for off-plan | Mandatory for off-plan |
| Developer regulation | Strict (few licensed) | Moderate (many developers) |
| Foreign ownership zones | Expanding | Well-established |
| Dispute resolution | ADREC + courts | DLD + RERA |
| Rental increase regulation | Market-based | RERA calculator limits |
Registration cost advantage: Abu Dhabi's 2% registration fee vs Dubai's 4% saves AED 40,000 on a AED 2M property — a significant transaction cost saving.
Rental Market Regulation
| Factor | Abu Dhabi | Dubai |
|---|
| Rent increase cap | No formal cap (market-based) | RERA Rent Calculator |
| Eviction notice | 2 months | 12 months |
| Dispute resolution | Tawtheeq + courts | RERA |
| Tenant protection | Moderate | Strong |
For landlords: Abu Dhabi's market-based approach allows more flexibility in rent adjustments, while Dubai's RERA calculator limits increases even when market conditions support higher rents.
Infrastructure and Lifestyle
Current Infrastructure
| Category | Abu Dhabi | Dubai |
|---|
| Metro system | Under construction (2029) | Operational (2 lines, 53 stations) |
| Airport | 1 (expanding) | 2 (DXB + DWC) |
| International flights | 120+ destinations | 250+ destinations |
| Shopping malls | Quality over quantity | Extensive (Dubai Mall, MoE, etc.) |
| Entertainment | Growing (Yas Island) | Extensive (diverse options) |
| Cultural attractions | Louvre, Qasr Al Hosn | Museum of the Future, cultural sites |
| Beaches | Less crowded, natural | Popular, developed |
| Safety ranking | #1 globally | Top 10 globally |
Lifestyle Comparison
| Factor | Abu Dhabi | Dubai |
|---|
| Pace of life | Relaxed, family-oriented | Fast, cosmopolitan |
| Cost of living | 15-20% cheaper | Baseline |
| Expat community | Growing, diverse | Large, established |
| Nightlife | Moderate | Extensive |
| Dining scene | Excellent, growing | World-class, extensive |
| Work-life balance | Emphasis on balance | Fast-paced professional |
| Family suitability | Excellent | Very good |
| Traffic congestion | Moderate | Higher |
Investment Strategy by Objective
For Maximum Yield
Winner: Abu Dhabi- Higher yields across all segments (0.5-1.5% advantage)
- Lower entry prices mean better return on capital
- Lower registration fees (2% vs 4%) improve net yield
Best strategy: Studios and 1-beds in Masdar City, Al Reef, or Al Reem Island for 7-8.5% yields.
For Maximum Capital Appreciation
Winner: Tie (depends on timing)- Abu Dhabi offers more growth runway (earlier in maturity cycle)
- Dubai has stronger international brand driving foreign capital
- Both markets appreciate in line with economic fundamentals
Best strategy: Off-plan in emerging communities — Hudayriyat (Abu Dhabi) or equivalent development zones.
For Liquidity and Exit Flexibility
Winner: Dubai- Larger market with more transactions
- Deeper international buyer pool
- More agents and platforms
- Better-known internationally (easier to sell to global buyers)
Best strategy: Premium communities (Dubai Marina, Downtown) with strong resale track record.
For Risk Minimization
Winner: Abu Dhabi- Shallower historical drawdowns
- Controlled supply pipeline
- Government employment stability
- Lower speculative activity
- 2% registration fee (lower transaction cost)
Best strategy: Established communities (Al Reem, Khalifa City) with stable tenant demand.
For Dual-City Lifestyle
Winner: Both- Abu Dhabi to Dubai: 1.5-hour drive (improving with rail)
- Many residents live in Abu Dhabi, work/socialize in Dubai
- Investment in both provides geographic diversification
Best strategy: Primary home in Abu Dhabi (lower cost), investment property in Dubai (liquidity).
Portfolio Allocation: Both Emirates
Recommended Split by Investor Profile
| Profile | Abu Dhabi Allocation | Dubai Allocation | Rationale |
|---|
| Yield-focused | 70% | 30% | Higher yields in Abu Dhabi |
| Growth-focused | 50% | 50% | Balanced appreciation potential |
| Risk-averse | 75% | 25% | Abu Dhabi's stability advantage |
| International (non-UAE) | 40% | 60% | Dubai's brand and liquidity |
| UAE resident | 60% | 40% | Abu Dhabi value + Dubai diversification |
| First-time UAE investor | 50% | 50% | Balanced exposure |
Practical Dual-Emirate Portfolio
Budget: AED 5,000,000| Property | Location | Price | Yield | Role |
|---|
| 2 x 1-bed apartments | Al Reem Island, AD | AED 1,800,000 | 7% | Income core |
| 1 x studio | Masdar City, AD | AED 550,000 | 8% | High yield |
| 1 x 1-bed apartment | Dubai Marina, DXB | AED 1,300,000 | 6% | Growth + liquidity |
| 1 x studio | JVC, Dubai | AED 650,000 | 7% | Balanced yield |
| Cash reserve | AED 700,000 | Emergency + opportunities |
| Portfolio yield | 7.0% | AED 301,000 annual |
Conclusion
Abu Dhabi and Dubai are complementary investment markets, not competitors. Abu Dhabi delivers higher yields, lower entry costs, shallower drawdowns, and lower transaction fees — making it the superior choice for income-focused and risk-averse investors. Dubai offers greater liquidity, international recognition, and a more established secondary market — making it better for investors prioritizing exit flexibility and global brand value.
Key Takeaways
- Yield advantage: Abu Dhabi delivers 0.5-1.5% higher yields across all segments
- Entry cost: Abu Dhabi is 20-50% cheaper than Dubai for equivalent properties
- Registration savings: 2% (Abu Dhabi) vs 4% (Dubai) — AED 40K on AED 2M property
- Stability: Abu Dhabi shows 30-50% shallower drawdowns historically
- Growth momentum: Abu Dhabi at +47% YoY transaction growth (2025)
- Liquidity: Dubai has 3-4x more market transactions
- Optimal split: Most investors benefit from 50-70% Abu Dhabi + 30-50% Dubai
The sophisticated investor does not choose between Abu Dhabi and Dubai — they allocate strategically across both, capturing Abu Dhabi's yield and stability while accessing Dubai's liquidity and international profile.
Sources & References
- Abu Dhabi Real Estate Market Report
- Dubai Real Estate Market Analysis
- Abu Dhabi vs Dubai Property Comparison
- DLD Transaction Data
- ADREC Market Statistics
- Global Property Guide UAE