Abu Dhabi Commercial Market Overview (2026)
| Metric | Value |
|---|
| Total office stock | 4.5+ million sqm |
| Grade A occupancy | 85-90% |
| Average Grade A rent | AED 1,500-2,500/sqm annually |
| Average Grade B rent | AED 800-1,400/sqm annually |
| Transaction growth (YoY) | +15-20% |
| Foreign company registrations | +25% YoY |
Key Business Districts
1. Capital Gate / ADNEC Area- Government offices, exhibition centre
- Grade A towers, hotel cluster
- Central location, highway access
2. Abu Dhabi Global Market (ADGM) — Al Maryah Island- International financial free zone
- 1,800+ registered companies
- Premium Grade A offices
- English common law jurisdiction
3. Corniche Area- Traditional CBD with government entities
- Mixed Grade A and B office stock
- Waterfront positioning
- Established corporate presence
4. Masdar City Free Zone- Clean technology and sustainability focus
- 800+ registered companies
- Tax incentives and free zone benefits
- Growing tech ecosystem
5. Abu Dhabi Airport Free Zone (ADAFZ)- Logistics and trade companies
- Airport proximity
- Competitive pricing
- Industrial and office mix
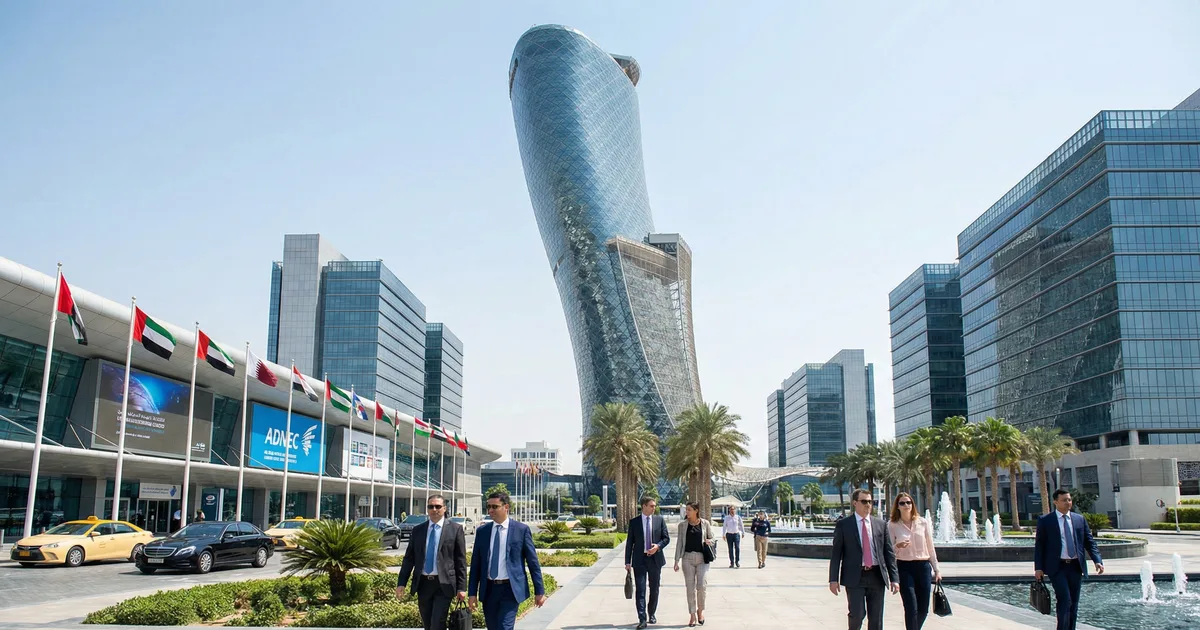
Capital Gate District Deep Dive
District Overview
Location: Central Abu Dhabi, adjacent to ADNEC
Key landmarks: Capital Gate tower (160m, 18° lean), ADNEC exhibition halls
Access: Al Khaleej Al Arabi Street, direct highway connectivity
Hotels: Andaz Capital Gate, Aloft Abu Dhabi
Capital Gate Tower
Architectural Significance
- 160 metres tall, 35 floors
- 18-degree lean (Guinness World Record)
- Designed by RMJM architects
- Opened 2011
- Houses Andaz hotel and office space
Office Specifications
| Feature | Specification |
|---|
| Grade | A+ |
| Floor plates | 1,400-2,800 sqm |
| Ceiling height | 3.2m (floor to ceiling) |
| Raised flooring | Yes |
| BMS | Fully integrated |
| Parking | Basement, podium |
| Green rating | LEED certified |
ADNEC (Abu Dhabi National Exhibition Centre)
Significance for Commercial Market
- 133,000 sqm of exhibition space
- Hosts 100+ events annually (ADIPEC, IDEX, Cityscape)
- 50,000+ business visitors per major event
- Drives hotel and office demand in surrounding area
- Government events generate corporate leasing activity
Commercial Investment Opportunities
Office Space Investment
Grade A Office (Premium)| Factor | Details |
|---|
| Price/sqft (purchase) | AED 1,200-2,000 |
| Annual rent/sqft | AED 120-200 |
| Rental yield | 8-10% |
| Tenant type | MNCs, government, financial services |
| Lease terms | 3-5 years typical |
| Vacancy | 10-15% |
Grade B Office (Value)| Factor | Details |
|---|
| Price/sqft (purchase) | AED 600-1,000 |
| Annual rent/sqft | AED 65-110 |
| Rental yield | 9-11% |
| Tenant type | SMEs, startups, professional services |
| Lease terms | 1-3 years |
| Vacancy | 15-25% |
Retail Space Investment
| Factor | Grade A (Mall) | Grade B (Street) |
|---|
| Price/sqft | AED 2,000-4,000 | AED 800-1,500 |
| Annual rent/sqft | AED 200-400 | AED 80-150 |
| Rental yield | 8-12% | 10-15% |
| Tenant type | Brands, F&B chains | Independent shops, services |
| Lease terms | 3-10 years | 1-3 years |
| Risk | Low-Medium | Medium-High |
Warehouse / Industrial
| Factor | Details |
|---|
| Price/sqft | AED 300-600 |
| Annual rent/sqft | AED 30-60 |
| Rental yield | 8-12% |
| Location | ICAD, Mussafah, KIZAD |
| Tenant type | Logistics, manufacturing, trading |
| Lease terms | 3-10 years |
Commercial vs Residential Investment
ROI Comparison
| Factor | Commercial | Residential |
|---|
| Gross yield | 8-12% | 5-8% |
| Capital appreciation | 3-5% annually | 6-10% annually |
| Total annual return | 11-17% | 11-18% |
| Lease duration | 3-10 years | 1-2 years |
| Tenant turnover | Low | Higher |
| Management complexity | Higher | Lower |
| Entry cost | Higher | Lower |
| Vacancy risk | Higher | Lower |
| Tenant quality | Corporate | Individual |
| Fit-out costs | Tenant bears | Landlord bears |
- Long-term income stability: 3-10 year leases with annual escalations (3-5%)
- Higher yields: 8-12% vs residential 5-8%
- Lower tenant management: Corporate tenants are self-managing
- Fit-out savings: Commercial tenants typically fit-out at own cost
- Contractual escalations: Built-in rent increases in lease agreements
- Capital appreciation: 6-10% annually vs 3-5% for commercial
- Lower vacancy risk: Residential demand is more resilient
- Easier to sell: Larger buyer pool for residential
- Lower entry cost: Can start from AED 450K vs AED 1M+ commercial
- Golden Visa eligible: Residential qualifies for investor visa
ADGM Commercial Investment
Free Zone Advantages
For Tenants
- 0% corporate tax (through 2026)
- 100% foreign ownership
- English common law framework
- Full profit repatriation
- International dispute resolution
For Investors
- High-quality corporate tenants
- Growing demand (1,800+ entities, +15-20% annually)
- Premium rents justify premium investment
- Global financial centre prestige
ADGM Office Pricing
| Category | Annual Rent/sqft | Purchase Price/sqft |
|---|
| Premium (Grade A+) | AED 200-300 | AED 2,500-4,000 |
| Standard (Grade A) | AED 150-200 | AED 1,800-2,500 |
| Flexible workspace | AED 250-400 | N/A (leased) |
Commercial Property Due Diligence
Essential Checks
Building Quality
- [ ] LEED or Estidama certification
- [ ] BMS (Building Management System) operational
- [ ] Elevator adequacy for floor count
- [ ] Parking ratio (minimum 1:50 sqm)
- [ ] Emergency systems compliant
- [ ] Service charge history (3 years)
Tenant Analysis
- [ ] Current tenant creditworthiness
- [ ] Lease expiry schedule
- [ ] Rental escalation clauses
- [ ] Break clause conditions
- [ ] Tenant fit-out investment (increases stickiness)
Location Assessment
- [ ] Highway access and visibility
- [ ] Public transport connectivity (current and planned)
- [ ] Surrounding amenities (F&B, retail, hotels)
- [ ] Competing office supply in area
- [ ] Government or institutional anchors nearby
Financial Due Diligence
- [ ] Actual vs quoted occupancy
- [ ] Net operating income (NOI) verification
- [ ] Service charge breakdown
- [ ] Capital expenditure requirements
- [ ] Insurance costs
Portfolio Strategy: Blending Commercial and Residential
Recommended Allocation
Conservative Portfolio (AED 5M)
- 70% Residential (AED 3.5M): 2 apartments for yield + appreciation
- 30% Commercial (AED 1.5M): 1 office unit for high yield
Balanced Portfolio (AED 10M)
- 50% Residential (AED 5M): 3-4 apartments or 1 villa + 2 apartments
- 35% Commercial office (AED 3.5M): 2 office units
- 15% Commercial retail (AED 1.5M): 1 retail unit
Aggressive Income Portfolio (AED 10M)
- 30% Residential (AED 3M): 2-3 high-yield apartments
- 50% Commercial office (AED 5M): 3-4 office units
- 20% Warehouse/industrial (AED 2M): 1-2 warehouse units
Expected Portfolio Returns
| Portfolio | Avg Yield | Appreciation | Total Return |
|---|
| Conservative | 6.5% | 6% | 12.5% |
| Balanced | 7.5% | 5% | 12.5% |
| Aggressive Income | 9% | 4% | 13% |
Conclusion
Abu Dhabi's commercial real estate market offers compelling diversification for property investors, with office yields of 8-12% significantly outperforming residential returns on a cash flow basis. The Capital Gate/ADNEC district and ADGM financial centre represent the city's premier commercial investment destinations, backed by government tenants, international corporations, and growing financial services demand.
Key Takeaways
- Higher yields: Commercial delivers 8-12% vs residential 5-8%
- Longer leases: 3-10 years providing income stability
- Corporate tenants: Self-managing with lower maintenance burden
- ADGM growth: 1,800+ companies driving premium office demand
- Capital Gate district: Grade A offices near ADNEC exhibition centre
- Portfolio diversification: 30-50% commercial allocation optimizes returns
- Entry point: Grade B offices from AED 600/sqft offer accessible entry
Sources & References
- Abu Dhabi Commercial Property Market
- ADGM Business Registration
- Capital Gate Tower Profile
- Abu Dhabi Office Market Report
- Commercial vs Residential ROI UAE
- ADNEC Events Calendar