Introduction
Abu Dhabi's rental market entered 2025 in a position of strength and finished the year with landlords in an even stronger position. Average residential rents across the emirate rose 11% year-on-year, driven by population growth of 7.5% in 2024, tightening vacancy rates, and a limited pipeline of ready-to-occupy units relative to demand. For investors, the numbers translate to some of the most attractive rental yields in the Gulf region -- and globally.
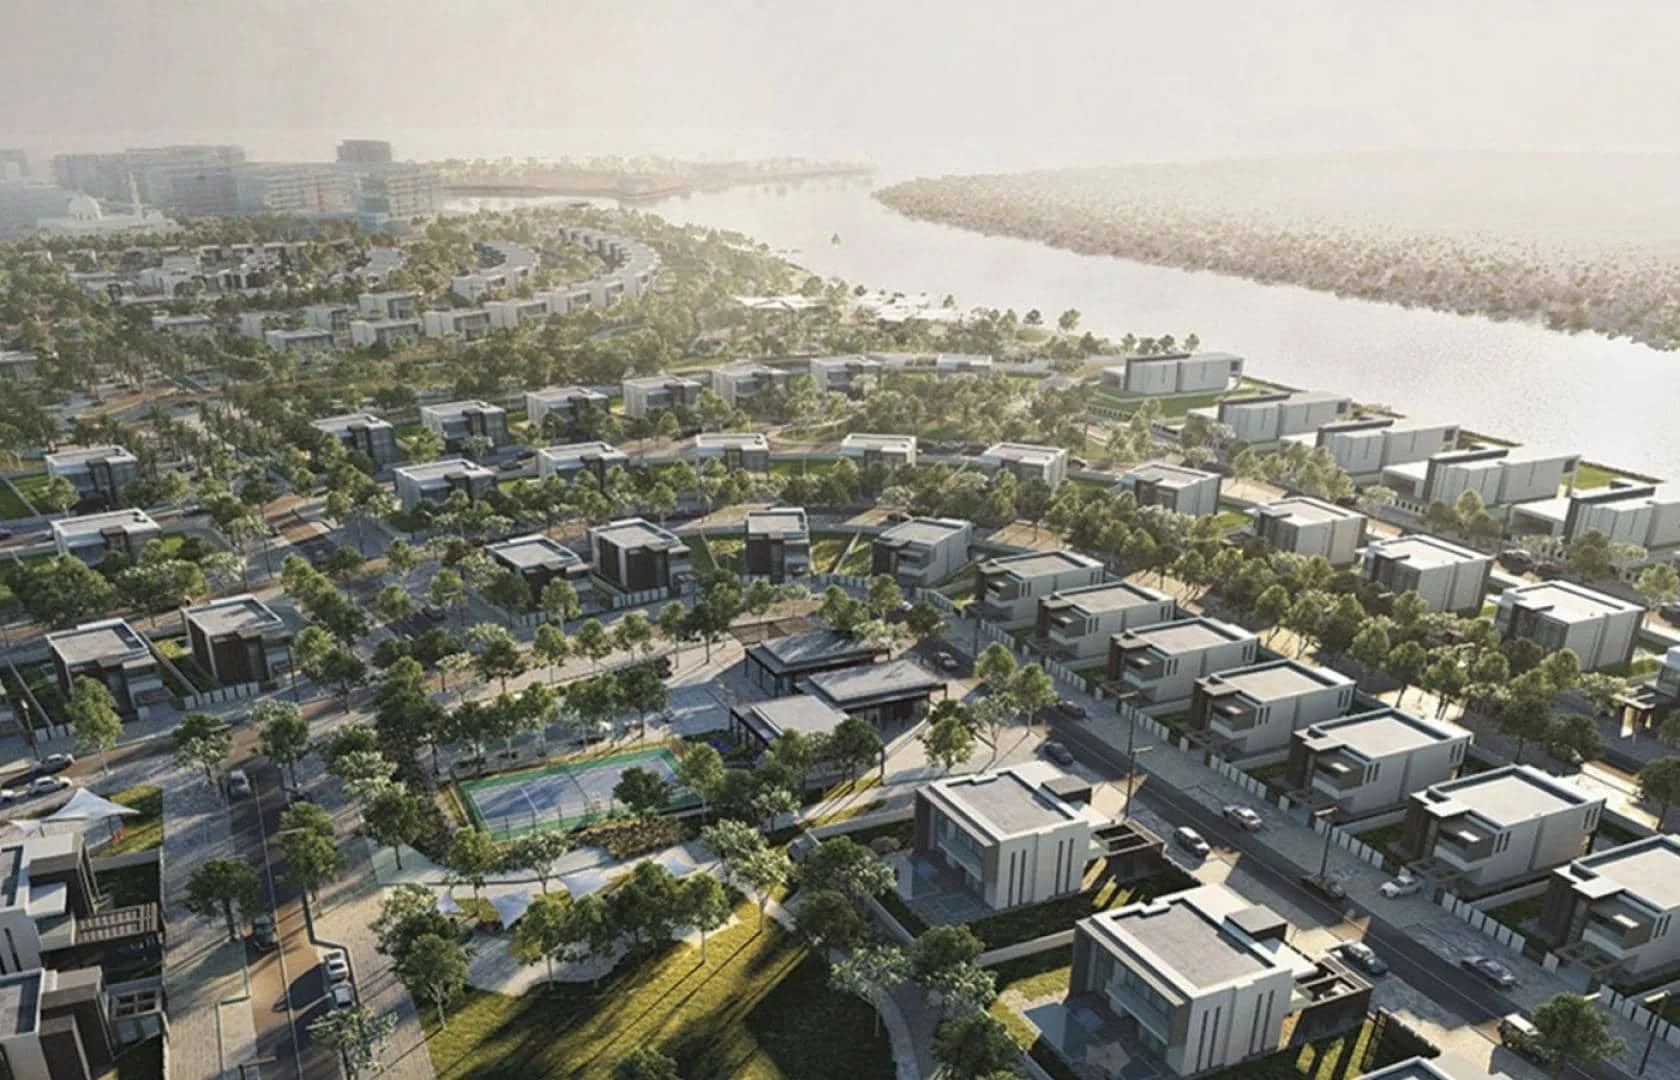
The emirate's rental dynamics in 2025 were shaped by several converging forces: the influx of professionals supporting Abu Dhabi's economic diversification, a wave of Golden Visa holders seeking long-term accommodation, the ripple effect of Dubai's rental escalation pushing tenants toward Abu Dhabi's relative affordability, and the maturation of lifestyle-oriented communities on Yas Island, Saadiyat Island, and Al Reem Island that are attracting higher-income tenants.
This report provides a comprehensive analysis of Abu Dhabi's 2025 rental market -- covering average rents by area and unit type, yield comparison tables, vacancy rates, tenant demographics, the impact of new supply, and actionable strategies for landlords looking to maximise returns.
Abu Dhabi Rental Market: 2025 at a Glance
| Metric | 2025 | 2024 | Change |
|---|---|---|---|
| Average Apartment Rent (Annual) | AED 72,500 | AED 65,300 | +11% |
| Average Villa Rent (Annual) | AED 185,000 | AED 168,000 | +10.1% |
| Average Gross Rental Yield (Apartments) | 7.8% | 7.2% | +0.6 pts |
| Average Gross Rental Yield (Villas) | 5.4% | 5.1% | +0.3 pts |
| Emirate-Wide Vacancy Rate | 8.2% | 11.5% | -3.3 pts |
| Rental Transactions Registered | 198,000+ | 172,000 | +15% |
| Average Rent Increase at Renewal | 8-12% | 5-8% | Accelerating |
Average Annual Rents by Area and Unit Type
The following table provides a detailed breakdown of average annual rents across Abu Dhabi's key residential communities. These figures represent the median asking rent for quality mid-range to premium units as of Q4 2025.
Apartment Rents
| Area | Studio | 1-Bedroom | 2-Bedroom | 3-Bedroom | YoY Change |
|---|---|---|---|---|---|
| Al Reem Island | AED 38,000 | AED 58,000 | AED 85,000 | AED 120,000 | +13% |
| Al Raha Beach | AED 40,000 | AED 62,000 | AED 95,000 | AED 135,000 | +11% |
| Yas Island | AED 42,000 | AED 65,000 | AED 98,000 | AED 140,000 | +15% |
| Saadiyat Island | AED 55,000 | AED 82,000 | AED 130,000 | AED 195,000 | +14% |
| Al Reef | AED 22,000 | AED 35,000 | AED 52,000 | AED 72,000 | +9% |
| Khalifa City | AED 25,000 | AED 38,000 | AED 55,000 | AED 78,000 | +8% |
| Masdar City | AED 35,000 | AED 52,000 | AED 78,000 | AED 105,000 | +12% |
| Al Maryah Island | AED 52,000 | AED 78,000 | AED 120,000 | AED 175,000 | +10% |
| Corniche Area | AED 45,000 | AED 68,000 | AED 100,000 | AED 150,000 | +7% |
| Al Ghadeer | AED 20,000 | AED 32,000 | AED 48,000 | AED 65,000 | +10% |
Villa and Townhouse Rents
| Area | 2-Bedroom TH | 3-Bedroom Villa | 4-Bedroom Villa | 5-Bedroom Villa | YoY Change |
|---|---|---|---|---|---|
| Yas Island | AED 120,000 | AED 170,000 | AED 220,000 | AED 300,000 | +14% |
| Saadiyat Island | AED 160,000 | AED 230,000 | AED 320,000 | AED 450,000 | +16% |
| Al Raha Gardens | AED 95,000 | AED 130,000 | AED 165,000 | AED 210,000 | +9% |
| Al Reef Villas | AED 65,000 | AED 85,000 | AED 105,000 | AED 130,000 | +8% |
| Khalifa City | AED 80,000 | AED 110,000 | AED 145,000 | AED 185,000 | +7% |
| Al Shamkha | AED 70,000 | AED 90,000 | AED 120,000 | AED 155,000 | +11% |
| Mohamed Bin Zayed City | AED 60,000 | AED 80,000 | AED 105,000 | AED 140,000 | +6% |
Rental Yield Comparison: Area by Area
Rental yield is the primary metric for buy-to-let investors. The following table ranks Abu Dhabi's key areas by gross rental yield for apartments, which combines rental income with the capital required (purchase price).
| Rank | Area | Avg. Purchase Price (2BR) | Avg. Annual Rent (2BR) | Gross Yield | Net Yield (Est.) |
|---|---|---|---|---|---|
| 1 | Al Reef | AED 515,000 | AED 52,000 | 10.08% | 8.5% |
| 2 | Khalifa City | AED 620,000 | AED 55,000 | 8.87% | 7.4% |
| 3 | Al Ghadeer | AED 560,000 | AED 48,000 | 8.57% | 7.1% |
| 4 | Al Reem Island | AED 1,050,000 | AED 85,000 | 8.10% | 6.7% |
| 5 | Masdar City | AED 980,000 | AED 78,000 | 7.96% | 6.5% |
| 6 | Yas Island | AED 1,350,000 | AED 98,000 | 7.26% | 5.9% |
| 7 | Al Raha Beach | AED 1,400,000 | AED 95,000 | 6.79% | 5.5% |
| 8 | Saadiyat Island | AED 2,200,000 | AED 130,000 | 5.91% | 4.7% |
Net Yield Calculation Notes
Net yield accounts for the following deductions from gross rental income:
| Deduction | Typical Range | Notes |
|---|---|---|
| Service charges | AED 8-25/sq ft/year | Varies by community; landlord pays |
| Property management | 5-8% of annual rent | If using a management company |
| Maintenance reserve | 2-3% of annual rent | Ongoing repairs, AC servicing, painting |
| Vacancy allowance | 2-4 weeks/year | Average re-letting period |
| Insurance (optional) | AED 500-2,000/year | Building insurance typically covered by HOA |
Vacancy Rates: Tightening Across the Board
Abu Dhabi's vacancy rate dropped to 8.2% in 2025, down from 11.5% in 2024 -- a significant tightening that has shifted bargaining power toward landlords.
| Area | Vacancy Rate 2025 | Vacancy Rate 2024 | Trend |
|---|---|---|---|
| Al Reem Island | 4.5% | 7.8% | Rapidly tightening |
| Yas Island | 3.8% | 6.2% | Rapidly tightening |
| Saadiyat Island | 5.2% | 8.0% | Tightening |
| Al Raha Beach | 6.0% | 8.5% | Tightening |
| Al Reef | 5.5% | 9.0% | Tightening |
| Khalifa City | 7.0% | 10.5% | Tightening |
| Corniche Area | 9.5% | 13.0% | Moderate improvement |
| Al Muroor / Tourist Club | 12.0% | 16.0% | Older stock, slower recovery |
Yas Island has the tightest vacancy at 3.8%, reflecting the island's transformation into a comprehensive live-work-play destination. At the other end, older areas like Al Muroor and Tourist Club still carry higher vacancy due to aging building stock, though even these areas are improving.
Tenant Demographics: Who Is Renting in Abu Dhabi?
Understanding tenant profiles helps landlords target the right market segment and make informed decisions about furnishing, unit size, and community selection.
| Tenant Segment | Share of Market | Preferred Areas | Avg. Budget (Annual) | Typical Lease |
|---|---|---|---|---|
| Single professionals | 28% | Reem Island, Masdar, Corniche | AED 45,000-70,000 | 1 year |
| Young couples (no children) | 18% | Reem Island, Yas Island, Al Raha | AED 65,000-95,000 | 1 year |
| Families (1-2 children) | 32% | Khalifa City, Al Reef, Al Raha | AED 85,000-150,000 | 1-2 years |
| Large families (3+ children) | 12% | Yas Villas, Saadiyat, Al Shamkha | AED 150,000-300,000 | 2+ years |
| Corporate tenants | 7% | Saadiyat, Al Maryah, Corniche | AED 120,000-250,000 | 1-3 years |
| Retirees / Golden Visa holders | 3% | Saadiyat, Yas, Al Raha Beach | AED 80,000-180,000 | 1-2 years |
Families remain the largest rental segment at 32%, followed by single professionals at 28%. The growing corporate tenant segment (7%) is particularly attractive to landlords as these tenancies tend to be longer, payments are more reliable (employer-guaranteed), and the units are typically maintained to a higher standard.
Furnished vs. Unfurnished Demand
The furnished rental segment has grown significantly, driven by short-term assignments, Golden Visa holders setting up residency, and the rise of remote workers choosing Abu Dhabi as a base.
| Category | Unfurnished | Furnished | Serviced Apartment |
|---|---|---|---|
| Share of rental transactions | 62% | 28% | 10% |
| Rent premium over unfurnished | Baseline | +20-35% | +60-100% |
| Average occupancy | 94% | 89% | 82% |
| Typical tenant | Families, long-term residents | Professionals, new arrivals | Short-term, corporate |
| Landlord involvement | Low (tenant furnishes) | Medium (maintain furnishings) | High (hotel-style service) |
| Initial investment (2BR) | AED 0 | AED 25,000-60,000 | N/A (operator manages) |
Furnished Rental Premium by Area
| Area | Unfurnished 2BR Rent | Furnished 2BR Rent | Premium |
|---|---|---|---|
| Al Reem Island | AED 85,000 | AED 110,000 | +29% |
| Yas Island | AED 98,000 | AED 130,000 | +33% |
| Saadiyat Island | AED 130,000 | AED 175,000 | +35% |
| Al Raha Beach | AED 95,000 | AED 120,000 | +26% |
| Masdar City | AED 78,000 | AED 100,000 | +28% |
Impact of New Supply on Rents
The pipeline of new residential units is the critical variable for rental market forecasting. Too much supply relative to demand compresses rents; too little sustains upward pressure.
| Year | New Unit Deliveries | Estimated New Rental Demand | Supply-Demand Balance |
|---|---|---|---|
| 2025 (Actual) | 4,800 | 8,500+ | Undersupply |
| 2026 (Projected) | 6,500 | 9,000+ | Undersupply |
| 2027 (Projected) | 12,400 | 10,000+ | Near balance |
| 2028 (Projected) | 21,000+ | 11,000+ | Potential surplus in select areas |
The current undersupply in 2025 and 2026 supports continued rent growth. Abu Dhabi's population is projected to reach 4.5 million by 2026, and the 6,500 units delivering in 2026 will not fully satisfy the estimated 9,000+ households entering the rental market. This dynamic is most acute in popular areas like Yas Island and Al Reem Island, where new supply is pre-leased before completion.
However, landlords should be aware that 2027-2028 deliveries are significantly larger. While demand growth should absorb much of this supply, areas with heavy concentration of new stock may see rent growth moderate.
Landlord Strategies for Maximising Returns in 2025-2026
Strategy 1: Optimise Rent at Renewal
With vacancy rates at historic lows, landlords have leverage at renewal time. Abu Dhabi's rental regulations permit rent increases in line with the Rental Index published by the Abu Dhabi Department of Municipalities and Transport.
- Review the Rental Index before each renewal to understand the maximum permissible increase
- Provide 90 days' notice for any proposed rent increase (as required by law)
- Offer modest discounts (2-3%) for tenants who pay the full year upfront via single cheque
- Consider 2-year leases at a slight premium to lock in occupancy and reduce turnover costs
Strategy 2: Target High-Demand Unit Configurations
Not all unit types perform equally in the rental market:
| Unit Type | Rental Demand | Yield Potential | Best For |
|---|---|---|---|
| Studio | High (singles) | 8-10% | Maximum yield, smaller investment |
| 1-Bedroom | Very High | 7.5-9% | Balanced yield and demand |
| 2-Bedroom | Highest | 7-8.5% | Broadest tenant pool (couples + small families) |
| 3-Bedroom | High | 6-7.5% | Families, longer tenancies |
| 4+ Bedroom | Moderate | 5-6% | Niche market, corporate tenants |
Two-bedroom apartments represent the sweet spot -- they attract the widest range of tenants (couples, small families, sharers) and command strong yields relative to investment size.
Strategy 3: Consider Furnished Letting for Premium Areas
In communities like Al Reem, Yas, and Saadiyat, furnished apartments command 25-35% rental premiums. The economics are compelling:
- Furnishing cost (2BR): AED 35,000-60,000 (mid-range quality)
- Annual rent uplift: AED 20,000-45,000
- Payback period: 1-2 years
- After payback: Pure incremental income for the remaining furnishing lifespan (5-7 years)
Strategy 4: Maintain Your Property Proactively
Tenant expectations in Abu Dhabi are rising. Properties that are well-maintained, freshly painted, and equipped with modern appliances rent faster and at higher rates. Budget AED 3,000-8,000 annually for preventive maintenance.
Strategy 5: Use a Professional Property Manager for Remote Landlords
For overseas investors, a property management company handles tenant sourcing, rent collection, maintenance, and regulatory compliance for 5-8% of annual rent. This cost is typically offset by higher occupancy rates and fewer vacancy days.
Regulatory Framework: What Landlords Must Know
| Regulation | Details |
|---|---|
| Tenancy registration | Mandatory via Tawtheeq (Abu Dhabi tenancy contract system) |
| Rent increase notice | 90 days minimum before lease expiry |
| Rent increase cap | Guided by Rental Index; no fixed percentage cap |
| Security deposit | Maximum 5% of annual rent (refundable) |
| Eviction grounds | Personal use, major renovation, sale (with 12 months' notice) |
| Maintenance responsibility | Structural: landlord; Minor: tenant; as per contract |
| Service charge payment | Landlord pays to community/developer |
Conclusion & Key Takeaways
- Abu Dhabi residential rents rose 11% on average in 2025, with standout increases of 15% on Yas Island and 14% on Saadiyat Island
- Al Reef leads rental yields at 10.08% gross for apartments -- the highest in the emirate and among the best globally
- Vacancy rates dropped to 8.2% emirate-wide, with Yas Island at just 3.8%, giving landlords strong negotiating positions at renewal
- Families (32%) and single professionals (28%) are the two largest tenant segments, making 2-bedroom and 1-bedroom apartments the most in-demand configurations
- Furnished rentals command 25-35% premiums in premium areas, with furnishing costs recouped in under 2 years
- The 2026 supply pipeline of 6,500 units remains below estimated demand of 9,000+ households, supporting continued rent growth
- Landlords should focus on proactive maintenance, strategic furnishing in premium locations, and optimal rent-setting at renewal to maximise returns
Sources & References
- Abu Dhabi Department of Municipalities and Transport (DMT) — Real Estate Services and Tawtheeq
- CBRE UAE — Real Estate Market Review Q4 2025
- Bayut — Abu Dhabi Rental Market Report 2025
- JLL UAE — Living Market Dynamics Q3 2025
- Property Finder — UAE Real Estate Market Insights Hub
- Asteco — Quarterly Real Estate Reports